Neonicotinoids and Bees
This vis was created using python along with plotly to visualize the data.
Visualization http://hbzxc.pythonanywhere.com/
Data sources:
Pesticide Usage by crop 1992-2017 https://www.sciencebase.gov/catalog/item/5e95c13a82ce172707f25252
Bee Colony Statistical Data 1987-2017 https://data.world/finley/bee-colony-statistical-data-from-1987-2017
over 200,000 individual data points
This was a group project. I mainly worked on parsing and mapping the information to choropleth maps.
I saw a documentary on neonicotinoids (neonic), and a lot of great evidence was presented. There were multiple studies showing links between bee population decline and rising neonic pesticide use. This was enough evidence to bring about bans of several neonicotinoids in the EU and the US. However, I did not see any visualizations of this information. There are a number of isolated studies that exist showing an impact on bees, but there does not seem to be a visualization that captures a large overview of the situation.
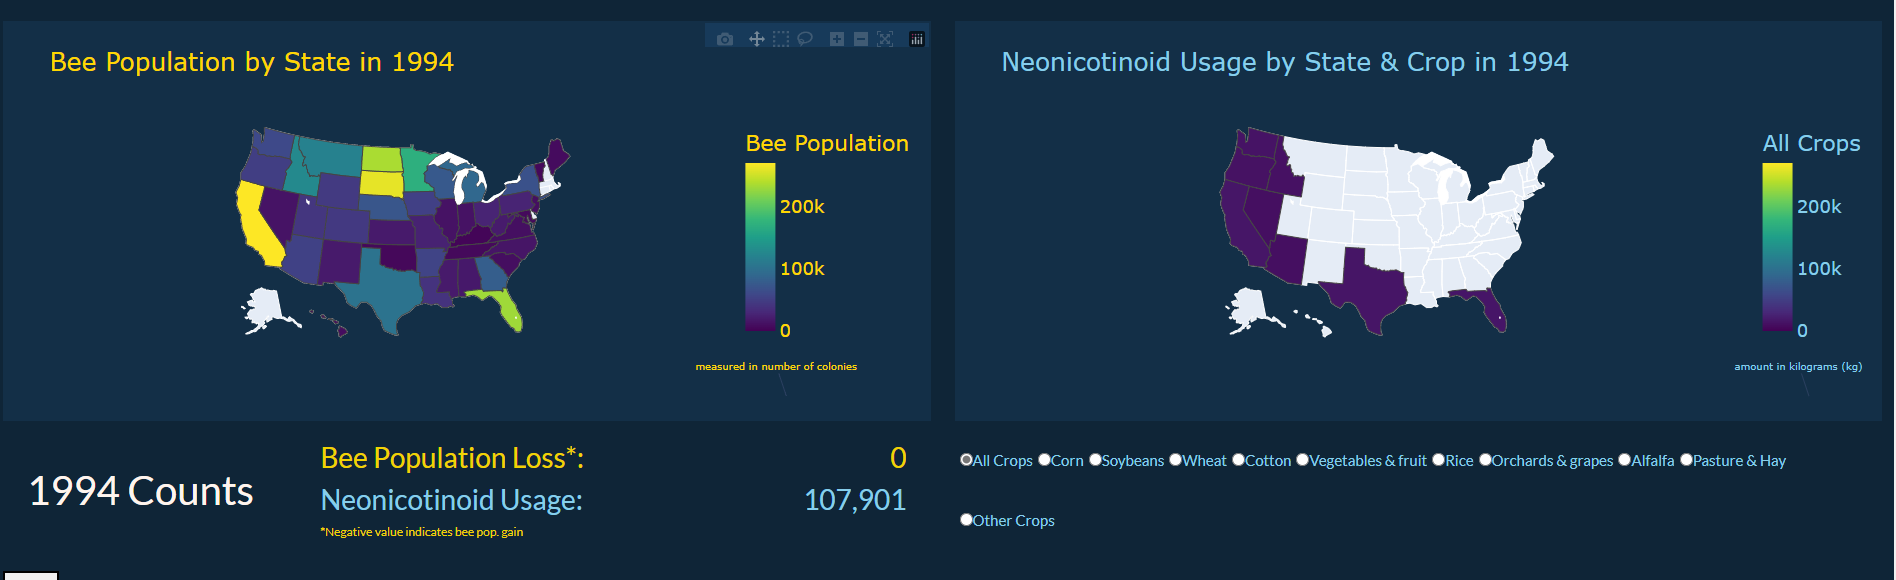
The visualizations that we created were made in an attempt to show an inverse correlation between neonic pesticide usage and bee population. We narrowed down the scope of this project to focus on the United States for pesticide usage which came from the US geological survey (USGS). The pesticide usage data is divided by crop, and information on US bee populations was provided by the USDA. Both provide a breakdown of usage and population by state. By looking at this information side by side, you would expect to see that as pesticide usage increases, the bee population would decrease in the corresponding area.
However, when shown side by side it is not quite as clear. The data trend did not quite follow the correlation that we predicted. In particular, bee populations started to rise again in 2009 while neonicotinoid usage is still increasing. One reason for this may be because a lot of Save the Bee campaigns sprung up in 2009, bringing more awareness to the decline in bee populations. In addition, some bees might have eventually gained immunity to neonicotinoids, which could explain why bee populations continue to increase as neonicotinoid usage rises. Not to mention, people may not have been keeping close track of bee populations until they realized how fast they were declining. There could be many factors at play.